
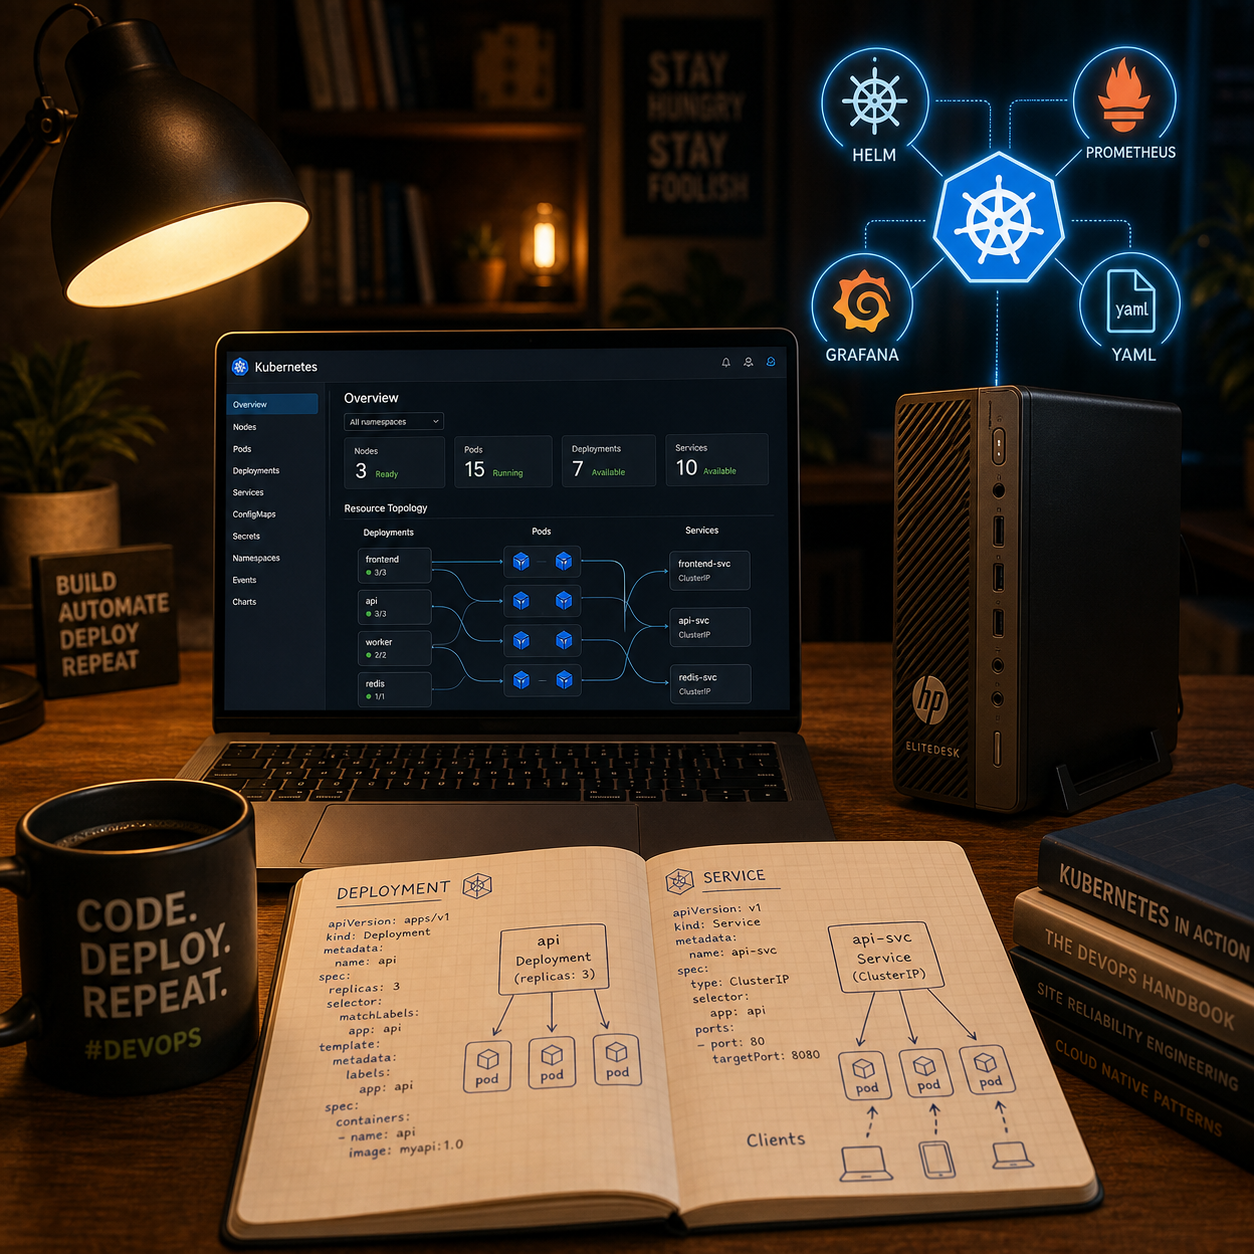
Over the last weekend I worked through a hands‑on Kubernetes fundamentals module and rebuilt everything in my own homelab, from simple pods all the way to Helm‑based monitoring with the kube‑prometheus‑stack. The goal was not just to “get it running”, but to really understand how the core building blocks of a Kubernetes platform fit together for day‑to‑day DevOps work.
From single Pods to real Deployments
The journey started with the basics: running containers as Pods, first via kubectl run and then as YAML manifests so everything is declarative and repeatable. On top of that I moved to Deployments, which add rolling updates, ReplicaSets, and proper lifecycle management instead of manually juggling pods. Playing with strategies like RollingUpdate and Recreate, plus tweaking maxUnavailable and maxSurge, made the rollout behavior very tangible and showed how Kubernetes protects you from breaking the whole app when a new version fails.
Services, networking and ephemeral storage
Once workloads were running, I explored how they talk to each other and to the outside. Services abstract away pod IPs and give you stable, DNS‑backed access points, which is essential once you start scaling or rolling out new versions. On the storage side I focused on ephemeral storage with emptyDir volumes: multiple containers in the same pod can share a scratch space, it survives container restarts, but disappears when the pod is deleted, which is perfect for transient data and a good reminder to not confuse it with persistent storage.
Namespaces, observability with k9s and kube‑prometheus
To keep things manageable I started organizing workloads into namespaces and then used k9s as a TUI to interactively inspect pods, logs, and events instead of typing every kubectl command by hand. For observability I installed the kube‑prometheus‑stack, which brings Prometheus, Alertmanager, the operator, node‑exporter and Grafana into the cluster with a single Helm release and exposes cluster metrics, node metrics and Kubernetes state metrics out of the box. Importing a pre‑built Grafana dashboard for namespace overviews made it very clear how much value you get once metrics, labels and dashboards come together.
Helm in practice: beyond “helm install”
The module then went deep into Helm, treating it as the “apt/yum for Kubernetes” that bundles Deployments, Services, Ingress, ConfigMaps, Secrets and more into reusable charts. I worked with the Homarr chart, inspected its Chart.yaml, values.yaml and templates, and learned how to override only what I need via my own values.yaml instead of forking manifests. A real highlight was debugging a failing release caused by a missing db-encryption secret: creating the secret with kubectl create secret ... and seeing the pod move from CreateContainerConfigError to Running made the interaction between Helm, Kubernetes resources and application requirements very concrete.
Key takeaways and next steps
The main lessons for me were: everything is YAML, Deployments manage ReplicaSets (not pods directly), ephemeral volumes like emptyDir have very specific lifecycles, and Helm is not “magic” but a smart templating and release‑management layer on top of the manifests I already know. With kube‑prometheus‑stack running, I now have a basic monitoring stack that I can iterate on, plus a clearer mental model for how operators and CRDs extend a cluster. Next up in my homelab I want to convert more docker‑compose based self‑hosted apps to Kubernetes manifests, expose them via Ingress and experiment with additional Helm charts, keeping the focus on understanding the YAML instead of copy‑pasting commands.